File:2005artichoke.PNG: Difference between revisions
Jump to navigation
Jump to search
This bubble map shows the global distribution of artichoke output in 2005 as a percentage of the top producer (Italy - 469,980 tonnes). This map is consistent with incomplete set of data too as long as the top producer is known. It resolves the accessibi |
No edit summary |
||
| Line 14: | Line 14: | ||
http://en.wikipedia.org/wiki/Image:2005artichoke.PNG | http://en.wikipedia.org/wiki/Image:2005artichoke.PNG | ||
[[category:Maps]] | |||
Latest revision as of 22:11, 23 April 2015
This bubble map shows the global distribution of artichoke output in 2005 as a percentage of the top producer (Italy - 469,980 tonnes).
This map is consistent with incomplete set of data too as long as the top producer is known. It resolves the accessibility issues faced by colour-coded maps that may not be properly rendered in old computer screens.
Data was extracted on 18th June 2007 from http://faostat.fao.org/site/336/DesktopDefault.aspx?PageID=336
Based on Image:BlankMap-World.png
Licensing
| Template:Lang |
![]() ⧼Wm-license-pd-author-self-text⧽
⧼Wm-license-pd-author-self-text⧽
⧼Wm-license-pd-author-not-legally-possible⧽
⧼wm-license-pd-author-self-any-purpose⧽
File history
Click on a date/time to view the file as it appeared at that time.
| Date/Time | Thumbnail | Dimensions | User | Comment | |
|---|---|---|---|---|---|
| current | 12:18, 21 June 2007 | 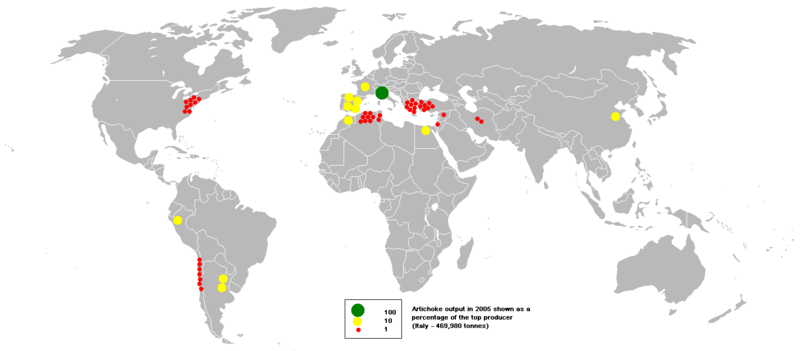 | 800 × 351 (86 KB) | MediaWiki default (talk | contribs) | This bubble map shows the global distribution of artichoke output in 2005 as a percentage of the top producer (Italy - 469,980 tonnes). This map is consistent with incomplete set of data too as long as the top producer is known. It resolves the accessibi |
You cannot overwrite this file.
File usage
The following page uses this file: